
Bitcoin is at a critical juncture after weeks of aggressive corrections and disappointing price action. The cryptocurrency is currently testing the crucial psychological level of $60,000 and is facing a critical phase where investor sentiment is shifting from fear to cautious optimism.
This transition comes as many are expecting a potential rally in the coming weeks. Top macro and on-chain analysts, including experts at CryptoQuant, have highlighted that if Bitcoin can break the significant resistance at $69,500, it could spark a substantial move towards new highs.
The data suggests that such a breakout could ignite a bullish uptrend, taking Bitcoin into previously uncharted territory. This critical price level could therefore be key to determining near-term direction. Investors and market watchers are keeping a close eye on this key level, as it has the potential to change the future course of BTC.
Bitcoin Bull Market: The Path to a New ATH
Bitcoin has seen a remarkable surge of over 15% since hitting local lows on September 6, leading to a significant shift in investor sentiment. This upward movement has led to renewed discussions among analysts and traders about the potential for a bull run.
The growing optimism is fueled by insights from leading on-chain analyst Axel Adler of CryptoQuant. Adler recently shared revealing data about Xindicating that BTC’s bull rally could begin once the price breaches $69,500. According to Adler, this key level is likely to trigger a wave of Fear of Missing Out (FOMO) in the market as previous profit-takers pull back into BTC, driven by the fear of missing out on potential gains.

Adler’s analysis highlights the BTC Annual Quantile Trends chart, a valuable tool for identifying bullish phases in the Bitcoin market. This chart suggests that breaking the $69,500 threshold, which is above the 75% quintile, will be crucial for initiating the next bullish phase. Historically, when Bitcoin begins a rally, it tends to be quick and volatile, often causing a shakeout among skeptical investors.
If Bitcoin successfully breaks above the $69,500 level, as crypto enthusiasts expect, it could mark the beginning of a significant bull run. The market’s reaction to this potential breakout will likely set the stage for Bitcoin’s price performance and overall market sentiment in the short-term.
BTC Technical Levels
Bitcoin is trading at $60,252 following a series of positive sentiment and bullish price action. The recent surge has pushed BTC above the critical 4-hour 200 exponential moving average (EMA) of $58,800, a level that has acted as resistance since early August.
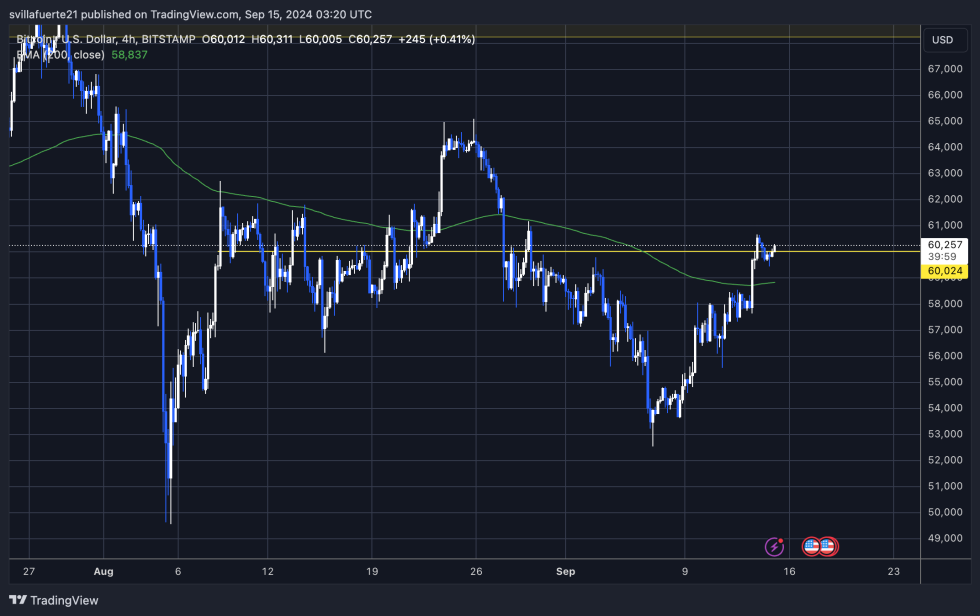
Bitcoin is now flirting with higher prices as it remains above $60,000, suggesting that the market may be positioning itself for significant gains in the coming months. This shift in momentum could herald the start of a stronger uptrend if Bitcoin continues to consolidate above $60,000.
However, if BTC fails to hold support at this level and drops below the 4H 200 EMA, a deeper correction is likely. The next major support level would be around $55,500, where demand could stabilize the price or potentially push it lower if selling pressure increases. The coming days will be crucial in determining whether BTC will continue its upward trajectory or face a temporary pullback as traders look for key levels to hold or break.
Main image of Dall-E, chart from TradingView