
XRP is finally gaining ground after days of struggling below the $0.60 supply level. This renewed momentum revives hope among investors and analysts who have been waiting for the altcoin to break out of its long-term consolidation phase.
XRP is starting to show signs of strength and market participants are keeping a close eye on whether the price can maintain this uptrend and challenge higher supply levels in the coming weeks.
Prominent crypto analyst Carl Runefelt recently shared an optimistic forecast for the altcoin, reflecting the broader market’s expectations of a significant price increase. According to Runefelt, XRP’s recent breakout could be the start of a more substantial move that could see the altcoin revisit key resistance levels last seen earlier this year. With optimism rising again, many are speculating whether this surge will finally allow the price to catch up with the gains of the broader crypto market.
As the price hovers around crucial levels, all eyes are on it XRP to see if it can maintain its upward momentum and break the barriers ahead. A successful breakout could set the stage for a strong rally, signaling a potential trend reversal and a new phase of growth for the digital asset.
XRP poised to reach $0.90
XRP is currently trading at a crucial supply level that must be broken before the altcoin can reach higher prices and keep pace with the broader market’s gains.
As positive sentiment spreads across the crypto market, traders and investors are eagerly looking for promising opportunities, and XRP’s price action has caught their attention. A strong break from this level could signal the start of a new rally, pushing XRP to new highs and potentially reviving interest in the asset.
Prominent analyst Carl Runefelt recently shared a technical analysis on Xfocused on the current situation of XRP. According to Runefelt, XRP trades within a daily triangle pattern – a key indicator of potential volatility and price movements.
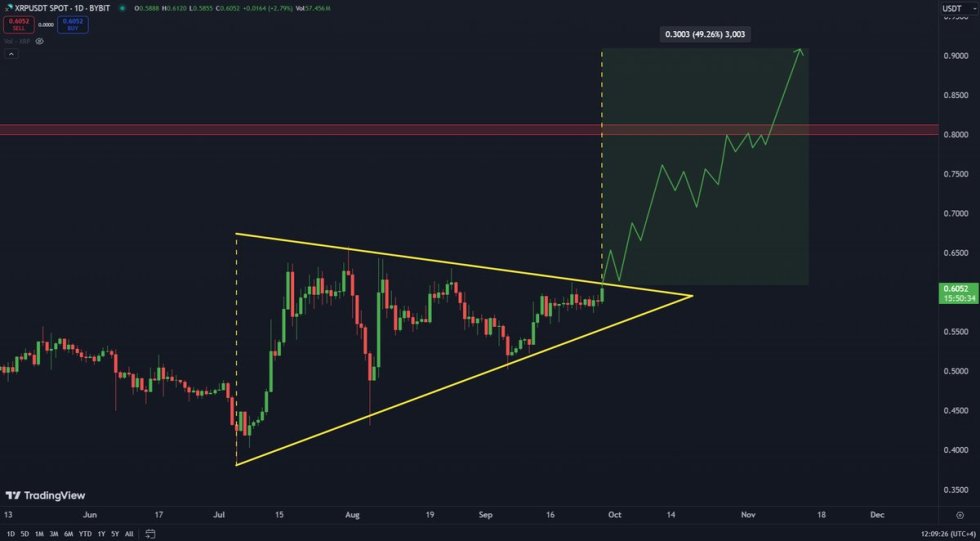
He points out that if this pattern breaks to the upside, it could push the price to higher supply levels around $0.90, which represents a substantial 50% upside from current levels. This would be an important step for XRP, in line with the optimistic outlook that many in the crypto community are hoping for.
However, for this scenario to materialize, XRP must first break the existing resistance levels and confirm a new uptrend. The current consolidation phase could serve as a springboard for a strong rally or signal continued indecisiveness. A successful breakout would likely attract more investors, leading to higher trading volumes and further price increases.
Price Action: Hold above $0.60
XRP is currently trading at $0.61, having risen modestly by 6% over the past day. The price remains strong above the daily 200 moving average (MA) at $0.54, indicating long-term strength. However, despite the recent rebound, the price is still struggling to break the crucial supply level around $0.65. This resistance has been a major hurdle for the asset, and until it is convincingly overcome, the current rally may lose momentum.
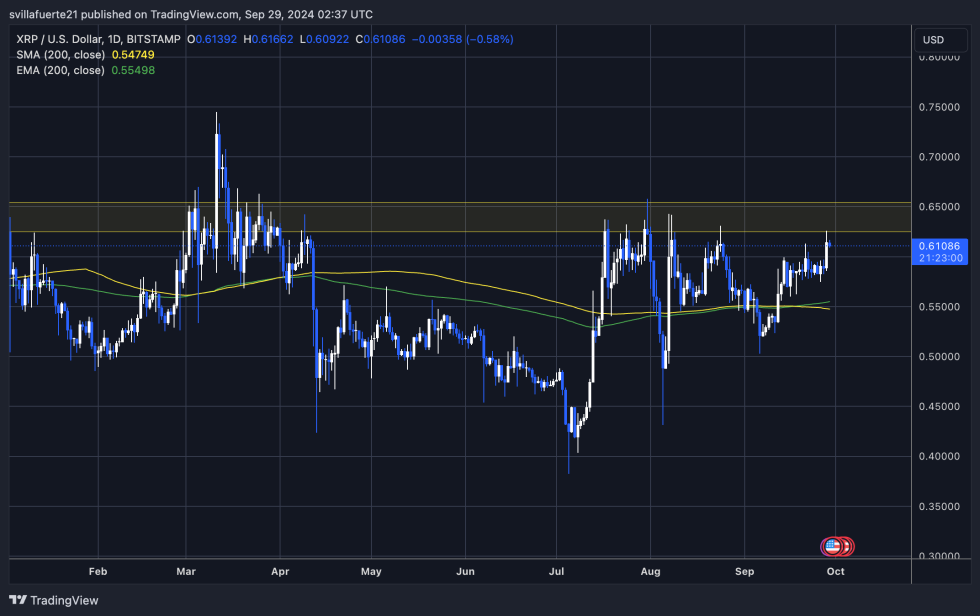
To maintain the bulls’ momentum, the price needs to set a new high above $0.65 and move towards the next target at $0.75. If achieved, this would likely attract more buying interest and further fuel the uptrend, bringing XRP in line with the broader positive sentiment in the crypto market.
On the other hand, if the price fails to close above the USD 0.65 level, it could lead to an extended period of sideways trading. This would likely frustrate investors hoping for a breakout and could result in reduced trading volumes. In this scenario, the price could continue to fluctuate within a certain range between $0.54 and $0.65 until a clear catalyst emerges that pushes the price higher or triggers a deeper correction.
Featured image of Dall-E, chart from TradingView