
Ethereum has dropped to the $2,350 level as on-chain data shows that whales have been making large investments on the exchange lately.
Ethereum Exchange Netflows Have Been Positive Lately
According to data from the market information platform IntoTheBlockThe ETH Exchange Netflow has been positive lately. The “Exchange Netflow“This refers to an on-chain indicator that tracks the net amount of Ethereum flowing into or out of wallets connected to centralized exchanges.
When the value of this metric is positive, it means that investors are depositing a net amount of tokens on these platforms. Since one of the main reasons why holders transfer their coins to the exchanges is for sale-related purposes, this trend could be bearish for the asset’s price.
On the other hand, the negative indicator implies that a net amount of BTC is being transferred from exchange-related addresses. Such a trend implies that investors are planning to hold for the long term, which can of course be bullish for the cryptocurrency.
Below is a chart showing the trend in Ethereum Exchange Netflow over the past month:
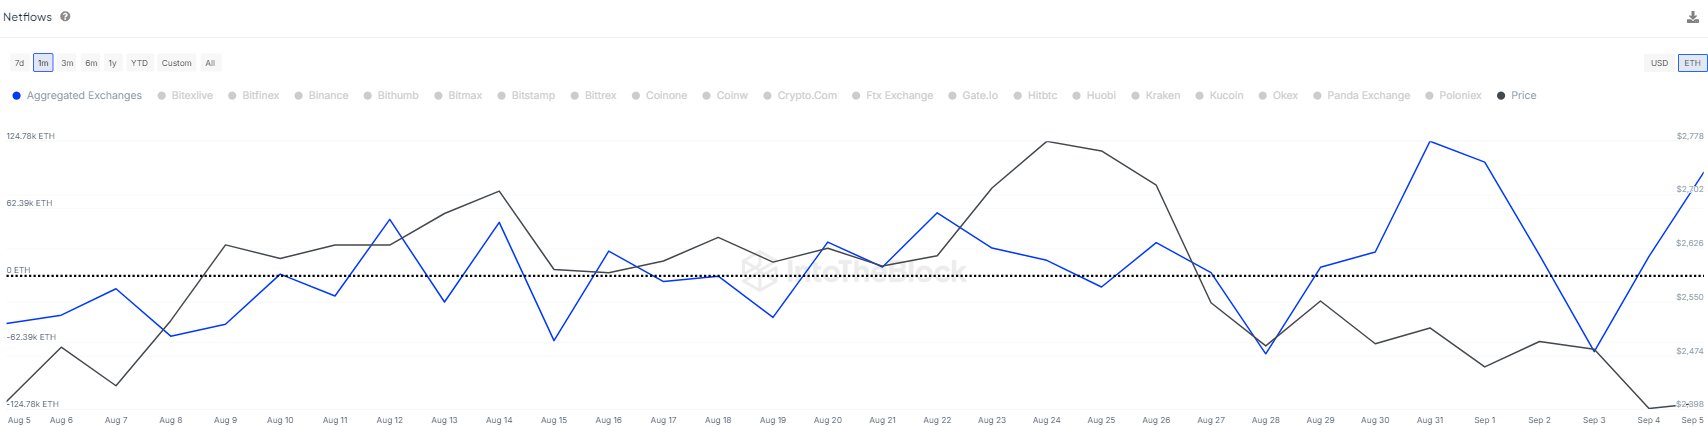
Looks like the metric has seen positive spikes recently | Source: IntoTheBlock on X
As can be seen in the chart above, the Ethereum Exchange Netflow has recently seen a number of spikes into positive territory. This suggests that there have been large net deposits on the exchanges.
Investors have transferred 312,183 ETH to these platforms in the past week, which is worth around $745 million at the current exchange rate. Given the sheer size of this, it is likely that whale entities behind this influx.
These giant investors may have been selling as a motive behind these large transactions. Something that could add credibility to this is that the Ethereum price has been falling during this period and is now below the $2,400 level.
Even before these latest deposits, exchanges had received net inflows over the past month, although not in large quantities. So the Ethereum market has been under pressure for a while now.
It may be worth keeping an eye on Exchange Netflow over the coming days, as further spikes in inflows could indicate a more negative price trend for Ethereum given the trend that has been seen recently.
ETH Price
Just like Bitcoin and other assets, Ethereum has been going through a rough patch recently, with its price gradually entering a bearish trajectory. After another drop of over 6% in the past week, ETH has fallen to around $2,350.
The chart below shows how cryptocurrencies have performed over the past few months.
The price of the coin appears to have been sliding over the last few months | Source: ETHUSD on TradingView
Main image from Dall-E, IntoTheBlock.com, chart from TradingView.com