
Bitcoin (BTC) is at a crucial level after a sharp 15% pullback from recent local highs. While traders and enthusiasts speculate on the causes of the downturn, the consensus is clear: demand is slowing.
Julio Moreno, head of research at CryptoQuant, has a in depth analysis of the situation, relying on key market indicators and data to explain the ongoing shift.
His analysis suggests that falling demand is a driving factor behind BTC’s recent price action. As the crypto market navigates through this turbulent period, uncertainty is growing, making it difficult for investors to anticipate the next big move.
As indecision spreads among market participants, the coming days could prove crucial for Bitcoin’s price action as bulls and bears battle at critical levels. Will BTC recover or is more downturn in store? Investors are keeping a close eye on signs of what’s to come.
Demand for Bitcoin is currently declining
Bitcoin (BTC) is currently facing significant selling pressure, mainly due to a noticeable drop in demand growth. According to CryptoQuant’s head of research, Julio Moreno, this demand issue is reflected in different valuation criteriathat are stuck in a bearish area.
One of the most telling indicators is the apparent demand for BTC (30-day sum), which has entered a negative zone, indicating weak buying interest. Moreno shared his analysis on X, noting that the most serious signals have flashed since July, when BTC demand began its steep decline.
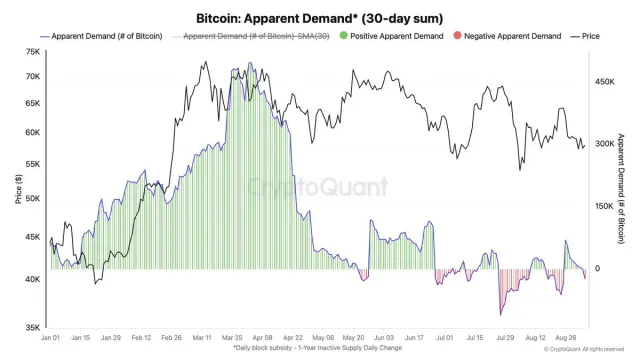
This slow growth in demand is the main reason why Bitcoin’s price has struggled to recover and start a new uptrend. While BTC managed to rally earlier this year, the lack of new demand has prevented it from sustaining higher levels.
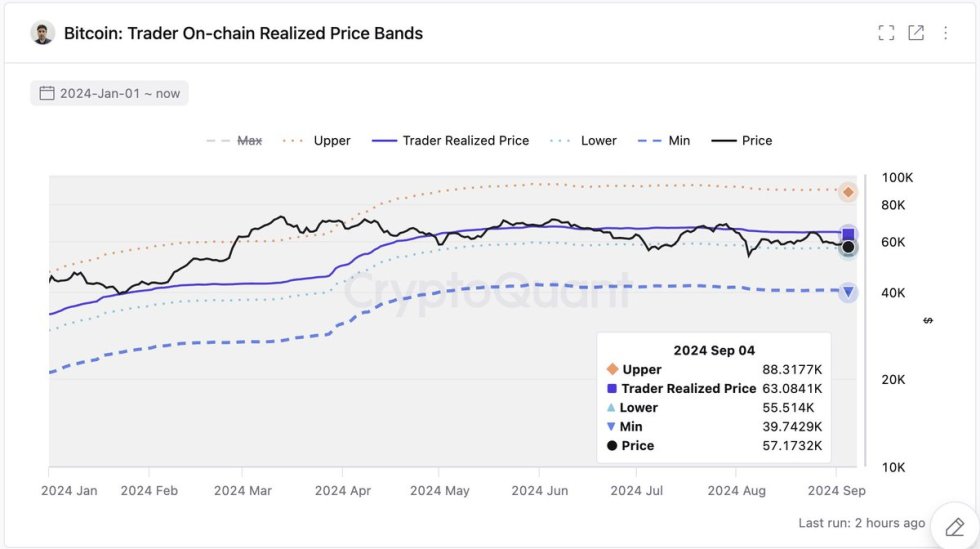
Moreno also pointed out that $55,500 is a key level to watch, which represents the lower realized price of traders on the blockchain. The market could remain weak without reclaiming this level, as it signals broader challenges in attracting new buyers. Investors will be keeping a close eye on these metrics to determine whether the market can bounce back or if more downturns are on the horizon.
BTC Price Action
Bitcoin (BTC) is trading at $56,087, barely holding above the critical $55,000 level after several days of slow decline and moderate price action. The recent stagnation in BTC price suggests that it could test the lower demand zone at $54,500.

If Bitcoin manages to maintain its position above $55,000, bulls will need to retake the 4-hour 200 moving average, currently at $59,373, and push the price above the significant psychological barrier of $60,000. This level is crucial for establishing a renewed bullish trend and gaining momentum.
Conversely, if BTC fails to hold the $54,500 support, a larger drop could be in the offing, potentially taking the price down to $49,000 or even lower. This would signal a bearish shiftchallenging current market sentiment and testing the resilience of Bitcoin’s recent gains.
Traders should keep a close eye on these key levels as a break below $54,500 could exacerbate the current downturn, while a recovery above $60,000 could reignite optimism.
Main image of Dall-E, chart from TradingView